You might already be familiar with the USDA Plant Hardiness Zone Map, which divides North America (where the United States are concerned) into 13 growing zones. But what if you live in Canada? Do these USDA zones also apply to your region?
While the US and Canada each define plant hardiness zones by a similar system of numbers and letters (to indicate zones and half zones), the two systems are not the same and cannot be used interchangeably.
USDA plant hardiness zones
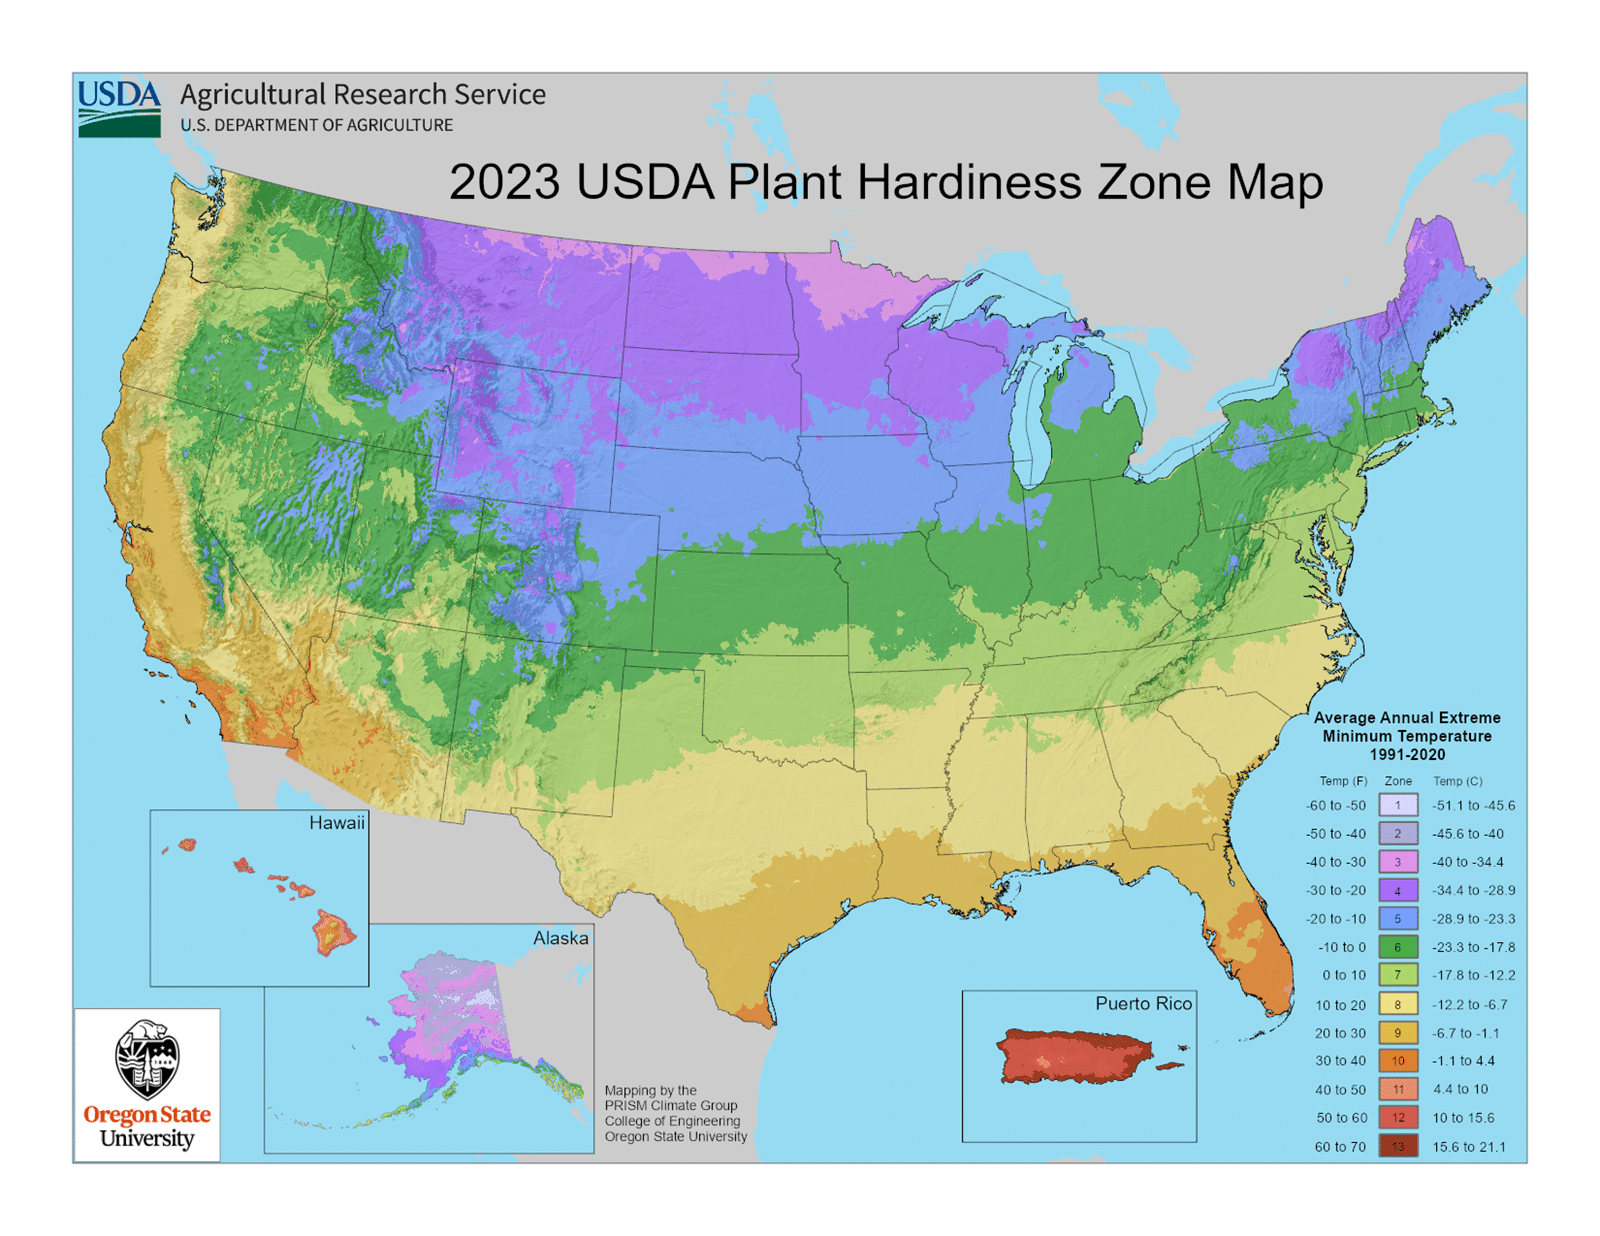
USDA plant hardiness zones, which range from 1a to 13b, are determined by one thing only: the average lowest temperature each region experiences in winter. The zones begin at 1a and climb a scale by 10°F per number, with the letters “a” and “b” representing 5° increments.
This system was created to help farmers, gardeners, and landscapers identify whether a perennial plant will thrive in their region and, most importantly, survive an average winter there.
Canadian plant hardiness zones
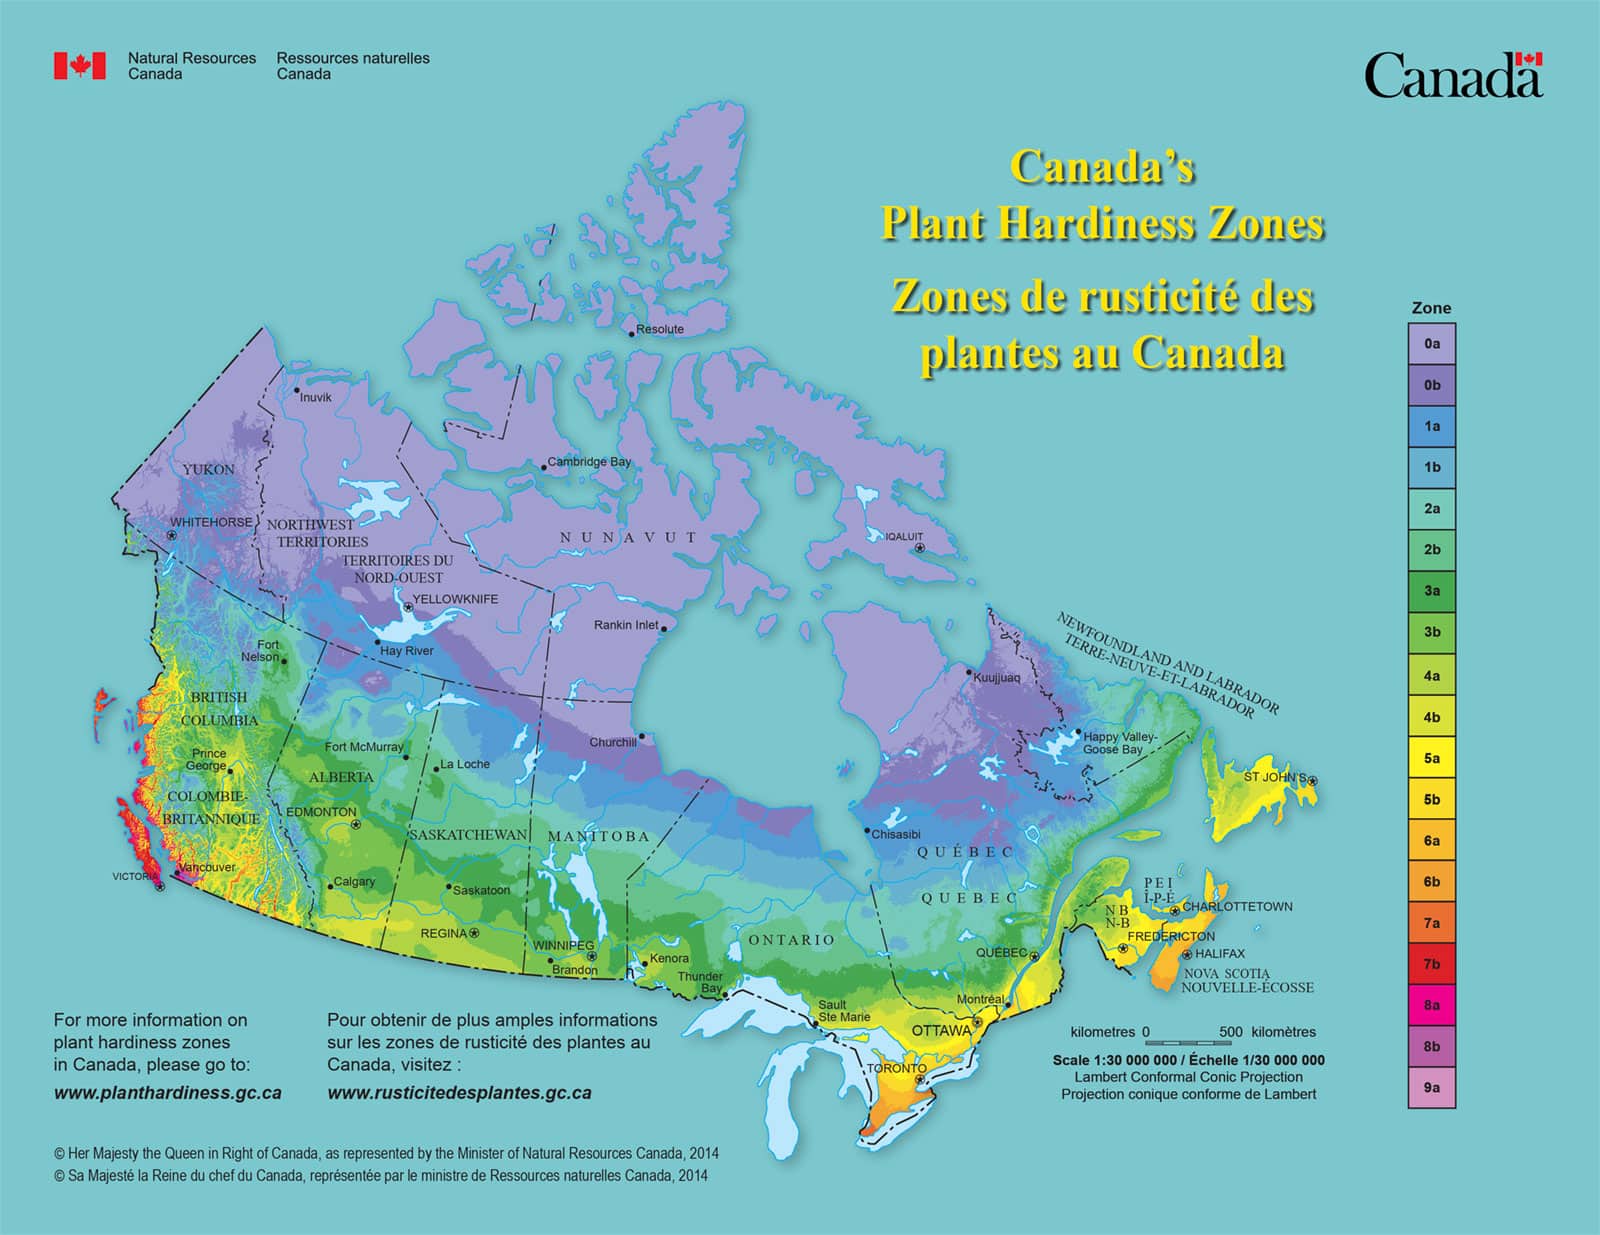
Canadian plant hardiness zones, which range from 0a to 9a, were first developed in the 1960s for trees and shrubs. The zone map has been updated several times since by National Resources Canada and combines a wide range of weather variables to give a more refined indication of climate suitability for all plants. Canadian zones are based on seven types of climatic conditions:
- Monthly average of the lowest temperatures of the coldest month of the year
- Monthly average of the highest temperatures of the warmest month of the year
- Average frost-free period where temperatures stay above 0°C
- Amount of rainfall from June to November
- “Winter factor,” which calculates temperature and precipitation in January
- Maximum snow depth
- Maximum wind gust in 30 years
How to convert USDA zones to Canadian climates
Since the USDA hardiness zone ratings are so simple, they can easily be extrapolated for other countries—and that’s what Canada’s government has done to simplify zone conversions for Canadians growing plants from the US (and vice versa).
The following chart of temperature conversions are taken from the USDA and Natural Resources Canada websites. Since it’s difficult to compare how US and Canadian zones relate without specific locations, I’ve included examples of Canadian locations that correspond to each USDA zone.
Other things to note:
- Two Canadian cities with the same USDA zone might be in different Canadian zones (due to other climate variables), so where available, two Canadian locations are listed to illustrate that.
- The chart only goes as far as USDA zone 9a, as Canadian climates don’t go any warmer than that.
| USDA zone | Average lowest temp °F | Average lowest temp °C | Canadian locations in that USDA zone | Corresponding Canadian zone |
|---|---|---|---|---|
| 0 | N/A | Below -51.1 | Extreme north, inland | 0a |
| 1a | -60 to -55 | -51.1 to -48.3 | Alert, Nunavut | 0a |
| 1b | -55 to -50 | -48.3 to -45.5 | Gjoa Haven, Nunavut | 0a |
| 2a | -50 to -45 | -45.5 to -42.8 | Whitehorse, Yukon Cambridge Bay, Nunavut | 0b 0a |
| 2b | -45 to -40 | -42.7 to -40.0 | La Loche, Saskatchewan Hay River, Northwest Territories | 2b 1a |
| 3a | -40 to -35 | -39.9 to -37.3 | Fort McMurray, Alberta Kuujjuaq, Quebec | 3a 0a |
| 3b | -35 to -30 | -37.2 to -34.5 | Edmonton, Alberta Winnipeg, Manitoba | 3b 3b |
| 4a | -30 to -25 | -34.4 to -31.7 | Prince George, British Columbia Calgary, Alberta | 4b 4a |
| 4b | -25 to -20 | -31.6 to -28.9 | Fredericton, New Brunswick Ottawa, Ontario | 5a 5b |
| 5a | -20 to -15 | -28.8 to -26.2 | Corner Brook, Newfoundland Barrie, Ontario | 5a 5b |
| 5b | -15 to -10 | -26.1 to -23.4 | Toronto, Ontario Charlottetown, Prince Edward Island | 6a 5b |
| 6a | -10 to -5 | -23.3 to -20.6 | Halifax, Nova Scotia London, Ontario | 6b 6a |
| 6b | -5 to 0 | -23.3 to -20.6 | Yarmouth, Nova Scotia Windsor, Ontario | 6b 7a |
| 7a | 0 to 5 | -17.7 to -15.0 | Kelowna, British Columbia | 6a |
| 7b | 5 to 10 | -14.9 to -12.3 | Penticton, British Columbia | 6a |
| 8a | 10 to 15 | -12.2 to -9.5 | Prince Rupert, British Columbia | 8a |
| 8b | 15 to 20 | -9.4 to -6.7 | Vancouver, British Colunbia | 8b |
| 9a | 20 to 25 | -6.6 to -3.9 | Victoria, British Columbia | 9a |